Yearly overview
Net sales overview
Sales per product category in 2023
2023
2022
2021
2020
2019
Net sales growth, %
-2,7
3,3
1,7
20,4
8,0
Gross margin, before items affecting comparability, %
25,9
24,0
27,0
28,1
29,5
Gross margin, %
25,3
22,5
26,9
28,0
29,3
EBITDA margin, before items affecting comparability, %
5,7
4,9
8,3
10,5
9,4
EBITDA margin, %
4,9
4,5
8,7
10,9
9,2
Operating margin, before items affecting comparability, %
1,6
0,8
4,2
6,6
5,7
Operating margin, %
0,8
-11,9
4,3
6,9
5,5
Profit margin, %
-0,9
-13,6
3,0
5,5
3,8
Return on capital employed, %
1,0
neg.
4,1
6,6
5,0
Net debt, SEK million
496
774
1436
1584
1353
Net debt / Adjusted EBITDA, multiple
2,7
4,4
4,4
4,2
4,4
Equity/assets ratio, %
64,9
62,8
54,4
45,1
48,6
Free cash flow, SEK million
315
180
2024 Q3 KPIs
The group
Organic growth of types of brands

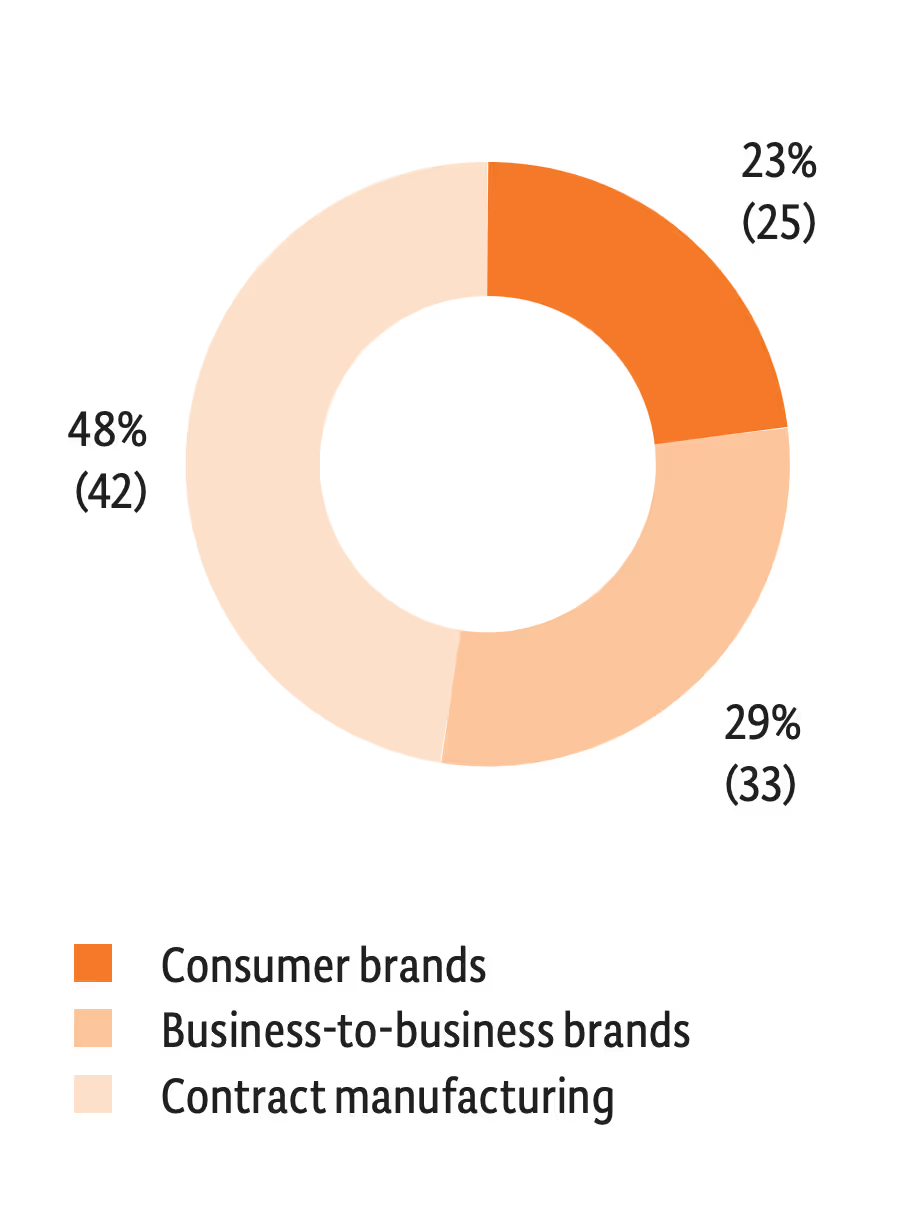
Product sales by type of brand

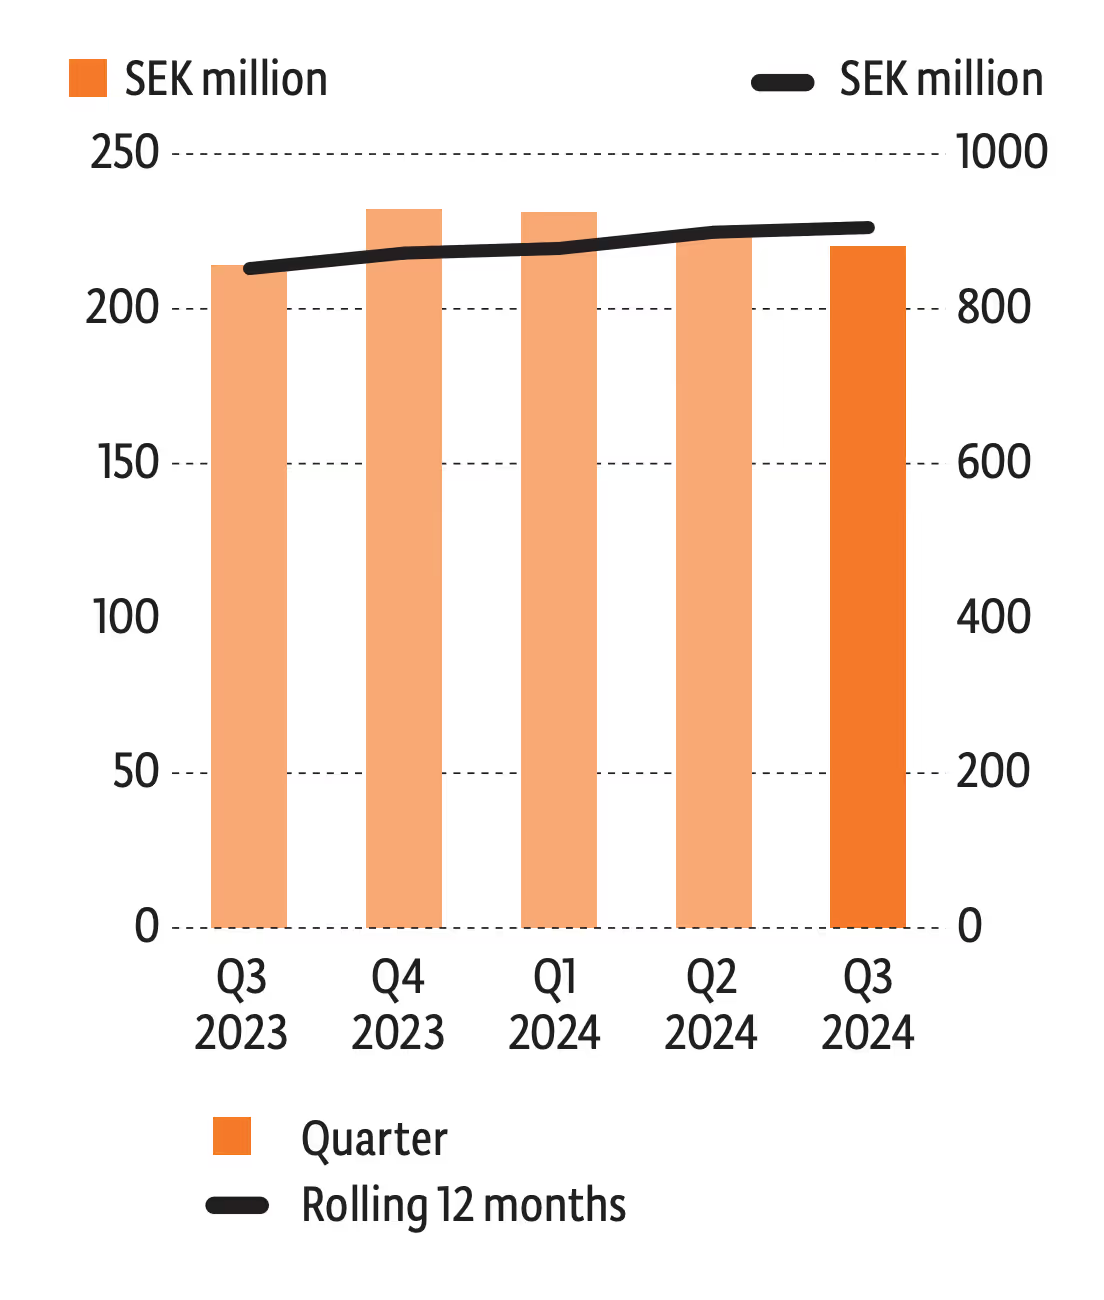
Net sales

Operating profit/loss, before items affecting comparability

Division Nordics
Organic growth of types of brands

Product sales by type of brand

Net sales

Operating profit/loss, before items affecting comparability

Division North Europe
Organic growth of types of brands

Product sales by type of brand
Net sales
Operating profit/loss, beforeitems affecting comparability

Division South Europe
Organic growth of types of brands

Product sales by type of brand

Net sales

Operating profit/loss, beforeitems affecting comparability

Financial targets
Profitable growth:
3-5% organic sales growth
Higher margins:
Groups EBIT margin 2027: >8%
Capital structure
Net debt/EBITDA: <2.5x
Read more in latest report
